January 5, 2024
 4 min reading


In the world of managing the supply chain, guaranteeing the quality of the products you acquire is essential for your success. A single mistake can disrupt the entire supply chain and undermine customer confidence. Neste blog, let's explore how to use um test for 1 proportion Minitab is not used to evaluate the rates of defects in fuel meters produced by a supplier for an automobile manufacturer.
UNDERSTANDING THE PROBLEM
Imagine a scenario in which your company manufactures vehicles and acquires fuel gauges from a supplier. Embora your supplier has a good reputation, your cars represent your high quality brand and part of your promise to customers is the focus on safety. Although you do not want to have any defects, you understand normal variability and define a taxa of defects of 2% as an oil limit for a supplier. To test your supplier, perform a calibration test on a set of fuel gauge samples to determine if the fault rate exceeds the oil limit.
DICE PIGGY
Your team selects 500 fuel meters supplied during the previous week and performs calibration tests on them. Two 500 fuel gauges, you identify 18 that are incorrectly calibrated.
TEST FOR 1 RATIO: OR WHAT IS IT?
Um tthis for 1 proportionAlso known as a sample proportion test or a binomial proportion test, it is a statistical tool used to determine whether the proportion of a given characteristic in a sample differs significantly from a known or hypothetical population proportion. In our case, we want to verify if the defect rate (ratio of fuel gauges per defect) is higher than the specified 2%.
DEFINITION OF THE HYPOTHESIS
The hypotheses for this test are:
- Hypothesize null (H0): the rate of defects is equal to or less than 2% (p = 0.02)
- Alternative hypothesis (Ha): the taxa of defects is greater than 2% (p > 0.02)
PERFORMING THE MINITAB TEST
- Escolha Estatísticas > Basic Statistics > test for 1 proportion.
- Choose Summary Data.
- Em Number of events, enter 18.
- Em Number of attempts, enter 500.
- Check Perform hypothesis testing.
- In the hypothetical proportion, enter 0.02.
- Click on Options.
- Go to the dialog box as shown below, and click OK.
INTERPRETAÇÃO TWO RESULTS
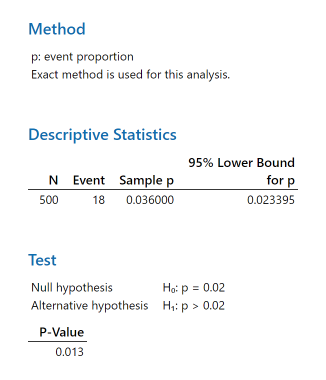
The results suggest that the defect rate is higher than 2%:
- lower limit of 95% for the defect taxa is 2.3395%, which is higher than 2%
- p value (0.013) is below the significance level (0.05)
Since the p value is below 0.05, we can rely on the null hypothesis and conclude that the rate of defects is higher than 2%.
Now that you have discovered that the rate of defects is greater than expected, you need to ensure that your measurement system is correct. If you have seen any unwanted variations in your measurement process, you may have been mistakenly identified as having a defective fuel gauge. (Happily, Minitab has a Measurement Systems Analysis Module designed specifically for that purpose!)
However, if you have confidence in your measurement system, consider asking the supplier to reformulate the fuel meter to improve accuracy. It may be time to find a new supplier who can supply the quality parts necessary to keep your supply chain running smoothly.
LEMBRE-SE DE CONSIDERAR O TAMANHO DA AMOSTRA
The manufacturing process display must be displayed randomly. If all 500 fuel meters are displayed in the same batch or have the same manufacturing date, the analysis would exclude variation between batches or sources of variability over time. The results may be biased, especially if they appear to consist of a set of exceptionally good or bad pieces.
MAKING SMARTER DECISIONS LIKE MINITAB
To use a tthis for 1 proportion In Minitab, supply chain managers can make decisions based on data about the quality of purchased products. This type of analysis allows companies to take appropriate measures, such as working closely with suppliers to improve manufacturing processes, guaranteeing smoother supply chains and greater customer satisfaction.
Content originally posted in: Minitab Blog
We are Software.com.br, Official Representative of Minitab Engageno Brazil and also a reference in technology solutions for the corporate world in Latin America. Count on our consultants specialized in Software Licensing, Cybersecurity, DevOps, Infrastructure and Data Analytics.
See more about Minitab on our site: Software.com.br